Programming and Written Assignment - Bayesian Networks & Decision Trees
The assignment should be submitted via Blackboard.
NOTE: This assignment is for 120 points.
Task 1
10 points
George
doesn't watch much TV in the evening, unless there is a baseball game
on. When there is baseball on TV, George is very likely to watch.
George has a cat that he feeds most evenings, although he forgets every
now and then. He's much more likely to forget when he's watching TV.
He's also very unlikely to feed the cat if he has run out of cat food
(although sometimes he gives the cat some of his own food). Design a
Bayesian network for modeling the relations between these four events:
baseball_game_on_TV
George_watches_TV
out_of_cat_food
George_feeds_cat
Your
task is to connect these nodes with arrows pointing from causes to
effects. No programming is needed for this part, just include an
electronic document (PDF, Word file, or OpenOffice document) showing
your Bayesian network design.
Based
on the data in this file, determine the probability table for each node
in the Bayesian network you have designed for Task 3. You need to
include these four tables in the drawing that you produce for question
3. You also need to submit the code/script that computes these
probabilities.
Task 3
15
points.
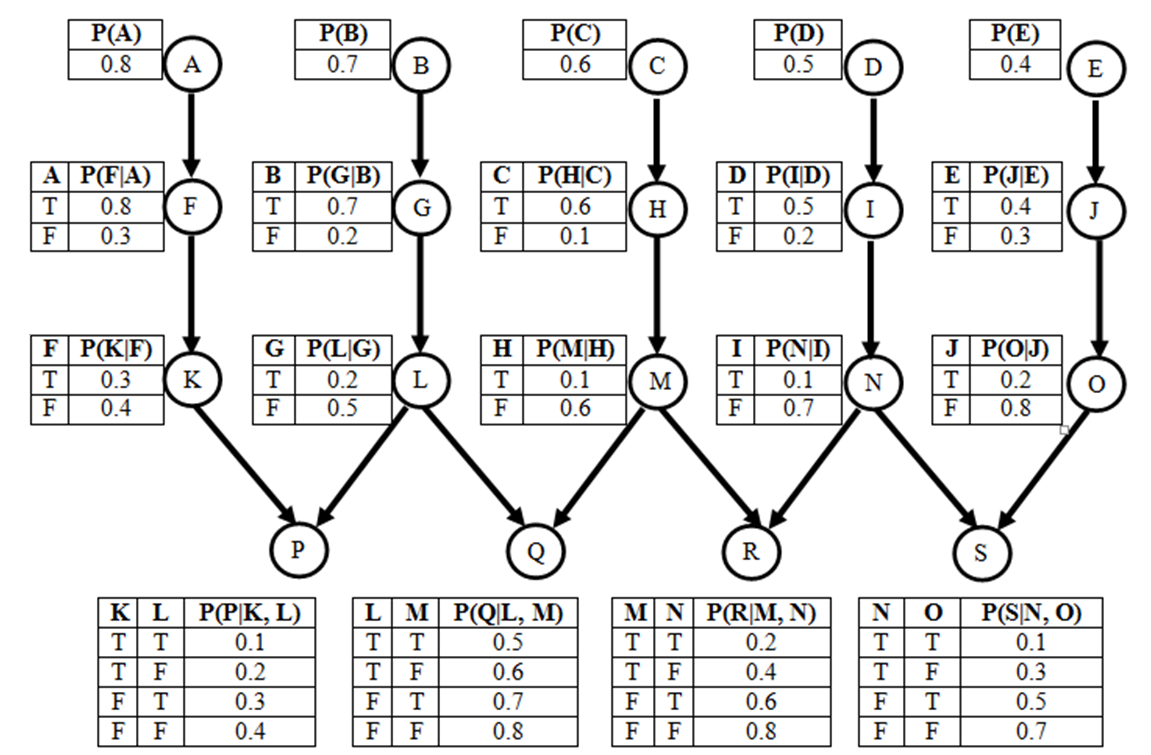
Figure 1: Yet another Bayesian Network.
Part a:On the
network shown in Figure 1, what is the Markovian blanket of node L?
Part
b:On
the network shown in Figure 1, what is P(H, C)? How is it derived?
Part c:On
the network shown in Figure 1, what is P(M, not(C) | H)? How is it
derived?
Hint: Part b,c have easier ways to arrive at the answer other than Inference by enumeration.
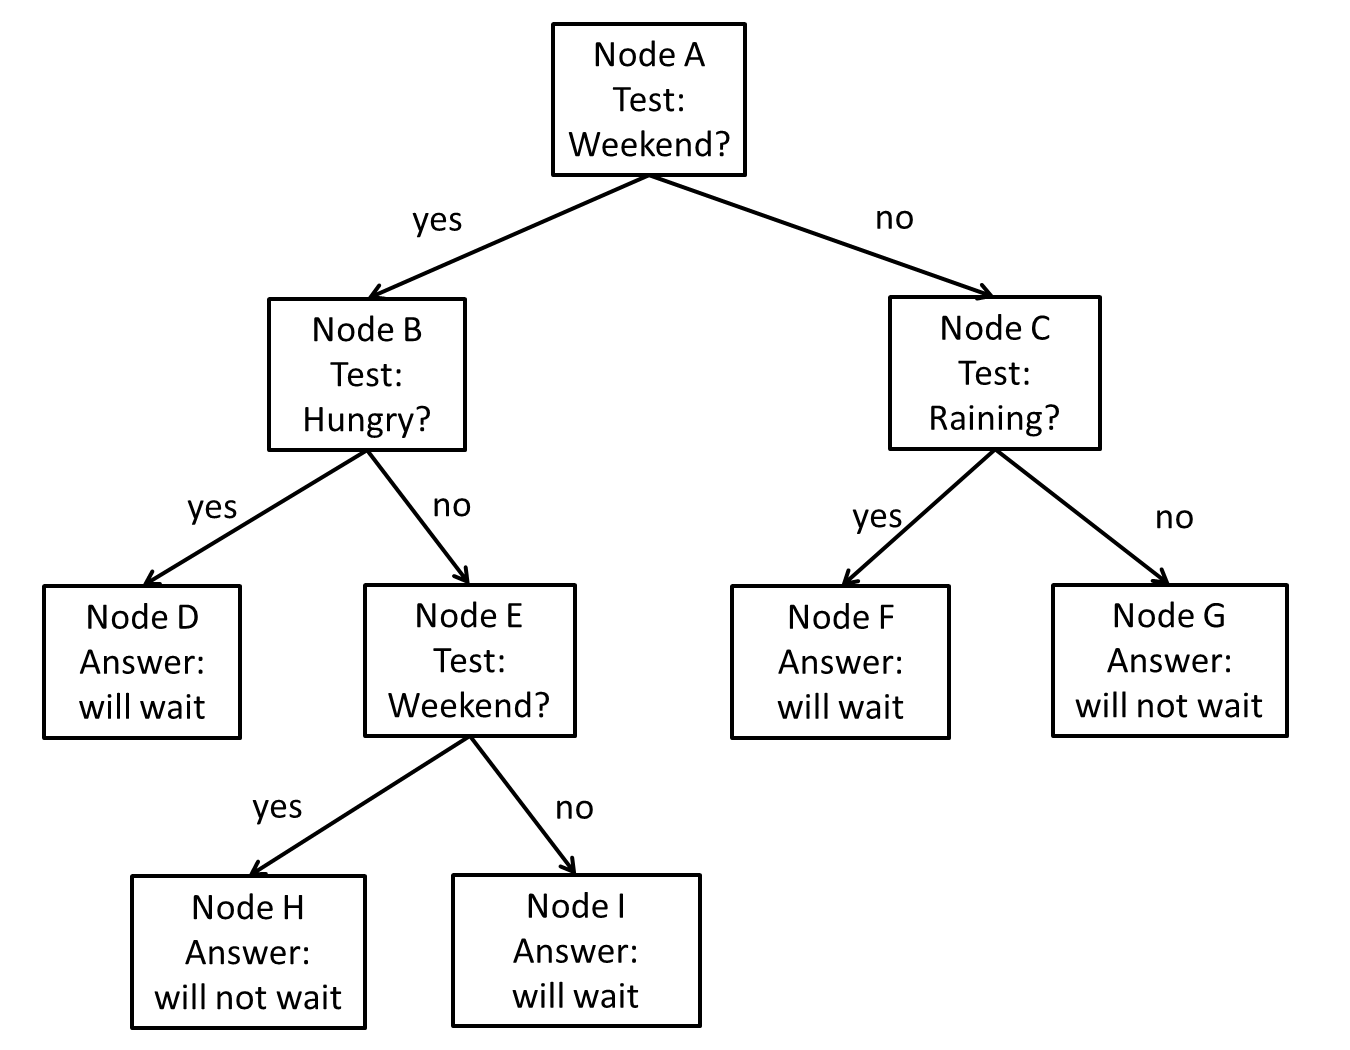
Figure 3: A decision tree for estimating
whether the patron will be willing to wait for a table at a restaurant.
Part a (5 points): Suppose that,
on the
entire set of training samples available for constructing the decision
tree of Figure 1, 80 people decided to wait, and 20 people decided not
to wait. What is the initial entropy at node A (before the test is
applied)?
Part b (5 points):
As mentioned in the
previous part, at node A 80 people decided to wait, and 20 people
decided not to wait.
Out of the cases where people decided to wait, in 20 cases
it was weekend and in 60 cases it was not weekend.
Out of the cases where people decided not to wait, in 15
cases it was weekend and in 5 cases it was not weekend.
What is the information gain for the weekend test at node A?
Part c (5 points):
In the decision tree of
Figure 1, node E uses the exact same test (whether it is weekend or
not) as node A. What is the information gain, at node E, of using the
weekend test?
Part d (5 points):
We have a test case of a
hungry patron who came in on a rainy Sunday. Which leaf node does this
test case end up in? What does the decision tree output for that case?
Task 6
15 points
Class
A
B
C
X
1
2
1
X
2
1
2
X
3
2
2
X
1
3
3
X
1
2
2
Y
2
1
1
Y
3
1
1
Y
2
2
2
Y
3
3
1
Y
2
1
1
We want to build a decision tree that determines whether a certain
pattern is of type X or type Y. The decision tree can only use tests
that are based on attributes A, B, and C. Each attribute has 3 possible
values: 1, 2, 3 (we do not apply any thresholding). We have the 10
training examples, shown on the table (each row corresponds to a
training example).
What is the information gain of each attribute at the root?
Which attribute achieves the highest information gain at the root?
Other Instructions
The code for the programming task has to run on OMEGA. Also
include a readme.txt file that has:
Name and UTA ID of the student.
What programming language is used.
How the code is structured.
Zip the files of your submission into
assignment9_<netid>.zip and submit the .zip file.