| Color = Red |
Color = Green |
Color = Blue |
|
| Vehicle = Car |
0.0450 |
0.0930 |
0.1620 |
| Vehicle = Van |
0.0495 |
0.1023 |
0.1782 |
| Vehicle = Truck |
0.0060 |
0.0124 |
0.0216 |
| Vehicle = SUV |
0.0495 |
0.1023 |
0.1782 |
Part a: How many numbers do you need to store in the joint distribution table of these 12 variables?
Part
b: What
is the most space-efficient way (in terms of how many numbers you need
to store) representation for the joint probability distribution of
these 12 variables? How many numbers do you need to store in your
solution?
George doesn't watch much TV in the evening, unless there is a baseball game on. When there is baseball on TV, George is very likely to watch. George has a cat that he feeds most evenings, although he forgets every now and then. He's much more likely to forget when he's watching TV. He's also very unlikely to feed the cat if he has run out of cat food (although sometimes he gives the cat some of his own food). Design a Bayesian network for modeling the relations between these four events:
For the Bayesian network of previous task, the text file at this link contains training data from every evening of an entire year. Every line in this text file corresponds to an evening, and contains four numbers. Each number is a 0 or a 1. In more detail:

Part
b: On
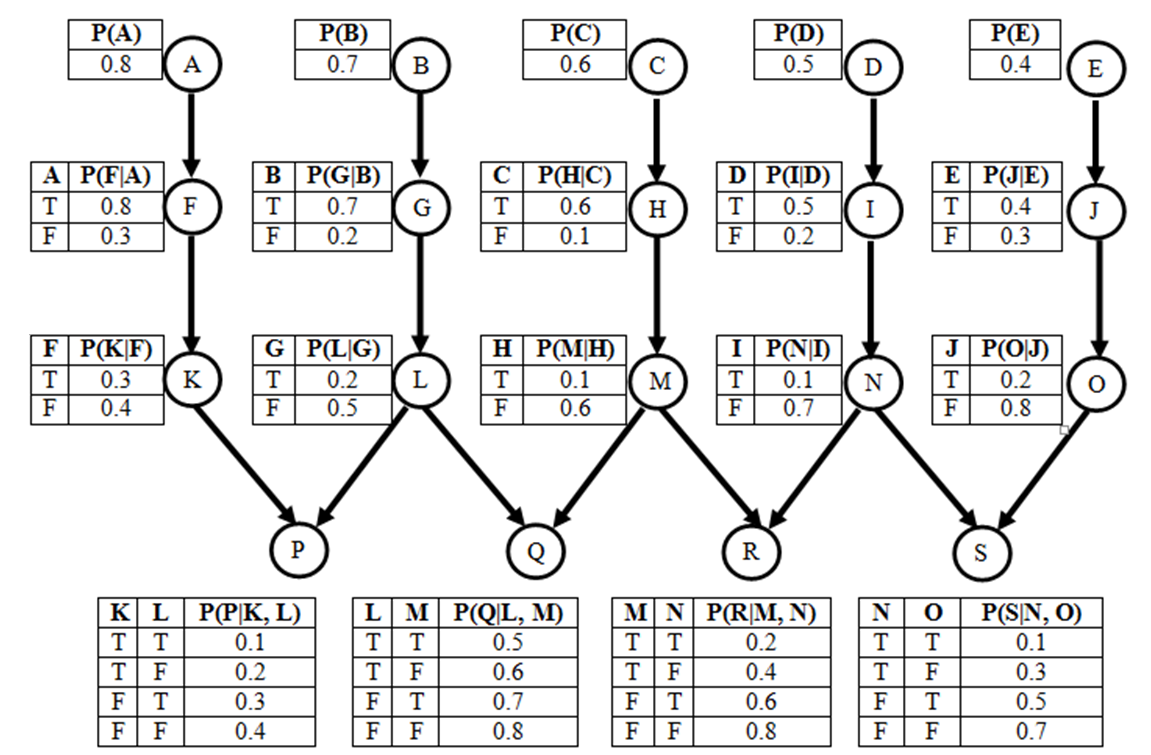
the network shown in Figure 2, what is P(I, D)? (Note: You can use
simplified calculations to calculate this as long as it is justified)
Part d: On the network shown in Figure 2, what is P(M, not(C) | H)? (Note: You can use simplified calculations to calculate this as long as it is justified)